



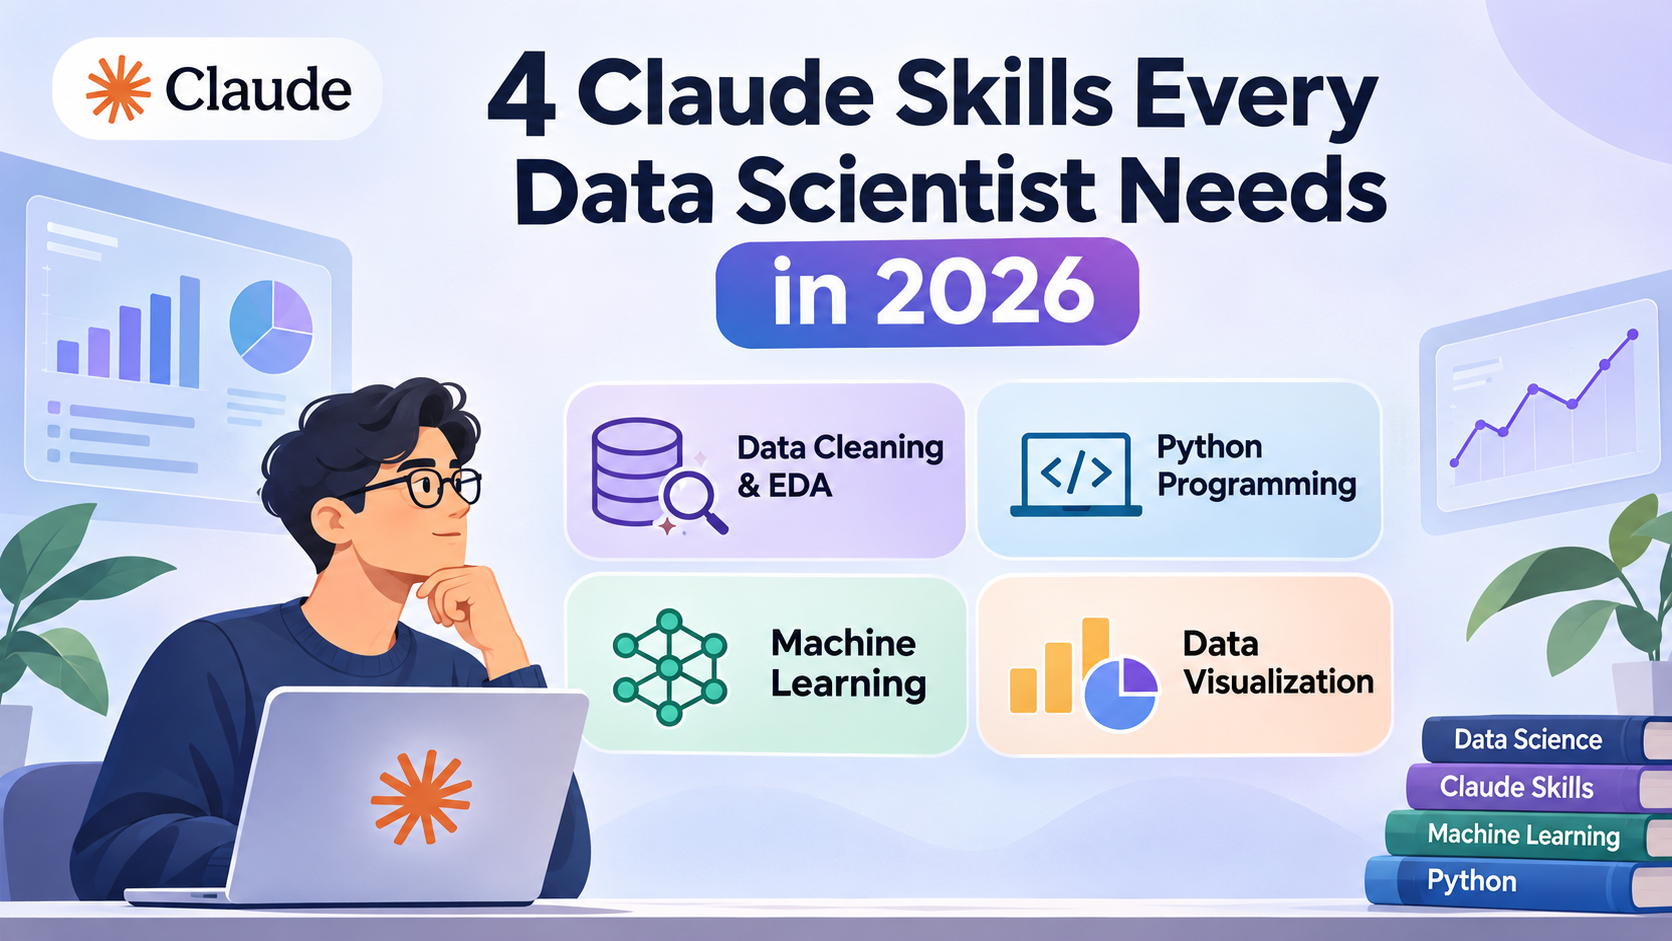
Data science is changing quickly, and artificial intelligence is becoming an important part of everyday data work. From cleaning large datasets to building machine learning models, data scientists now have access to AI tools that can reduce repetitive work, improve productivity, and make complex tasks easier. One technology gaining attention is Claude Skills, which helps users create reusable instructions and workflows for specific tasks.
In 2026, learning how to use Claude Skills can give data scientists an advantage. Instead of writing the same instructions repeatedly, they can build structured workflows for data analysis, Python programming, data visualization, and machine learning. These skills can help beginners learn faster and allow experienced professionals to focus on solving important business problems. In this article, we will explore four useful Claude Skills every data scientist should understand, how they work, how to use them, and how they can improve your daily data science workflow.
1. What Are Claude Skills and Why Do Data Scientists Need Them in 2026?
Claude Skills are reusable packages of instructions, resources, and optional code that help Claude perform specific tasks in a consistent way. You can think of them as training guides that teach Claude how to complete a particular type of work.
For example, imagine that you regularly receive Excel files from different clients. Every time, you need to remove duplicate records, handle missing values, check data types, and prepare a report. Instead of explaining these steps to Claude every time, you can create a custom data-cleaning skill.
Once the skill is available, Claude can use its instructions whenever you request a relevant task.
According to Anthropic’s documentation, skills can include:
- Instructions written in Markdown.
- Python or JavaScript scripts.
- Reference documents and useful resources.
- Reusable templates.
- Examples of expected inputs and outputs.
Claude uses a process called progressive disclosure. It first checks the skill’s name and description, then loads the detailed instructions and additional resources when they are relevant. This helps avoid loading unnecessary information into every conversation. Claude Help Center+1
For data scientists, this approach is useful because many daily responsibilities follow repeatable processes.
These responsibilities include:
- Cleaning and preparing datasets.
- Performing exploratory data analysis.
- Writing Python and SQL code.
- Testing statistical assumptions.
- Training machine learning models.
- Creating charts and dashboards.
- Preparing reports for business teams.
Claude Skills do not replace a data scientist’s knowledge. They provide a structured way to reuse expertise, reduce repetitive instructions, and improve the consistency of AI-assisted work.
2. Skill One: Data Cleaning and Exploratory Data Analysis (EDA)

Data cleaning is one of the most important responsibilities of a data scientist. Before building a machine learning model or making business decisions, you need to understand whether the available data is accurate, complete, and useful.
Unfortunately, real-world datasets are rarely perfect.
You may receive files containing missing values, duplicate records, incorrect dates, inconsistent category names, unusual numbers, and formatting problems. Handling these issues manually can take a lot of time.
This is where a Claude Data Cleaning and EDA Skill becomes useful.
What Does This Skill Do?
A Data Cleaning and Exploratory Data Analysis Skill teaches Claude how to inspect a dataset, identify common data-quality problems, and prepare a structured analysis.
For example, when you upload a CSV or Excel file, Claude can help you:
- Understand the number of rows and columns.
- Identify missing and duplicate values.
- Check incorrect data types.
- Find unusual values and possible outliers.
- Understand numerical and categorical columns.
- Explore relationships between variables.
- Generate an initial data-quality report.
The main purpose is to make your dataset ready for further analysis.
Important Features of a Data Cleaning Skill
1. Missing Value Detection
Missing values are common in real-world datasets. For example, a customer database may contain records without email addresses, phone numbers, or purchase information.
Claude can use Python libraries such as Pandas to identify missing values and calculate their percentage in each column.
It can also suggest suitable approaches, such as removing incomplete records, filling numerical values with a median, or using a suitable imputation method.
However, the correct approach depends on why the values are missing. Automatically filling every missing value with an average can create misleading results.
2. Duplicate Data Identification
Duplicate records can affect business reports and machine learning models.
For example, if a customer appears five times in a sales dataset because of accidental duplication, your revenue and customer-count analysis may become incorrect.
Claude can help identify exact duplicates and possible duplicate records based on selected columns.
3. Outlier Detection
Outliers are values that are significantly different from the majority of observations.
For example, imagine an online store where most customers spend between ₹500 and ₹5,000, but one transaction shows ₹5,00,000.
This value could represent a genuine large purchase or a data-entry error.
Claude can help identify such observations using statistical methods such as the interquartile range (IQR), standard scores, and visual inspection.
It should not automatically remove every outlier because unusual values may contain important business information.
4. Exploratory Data Analysis
Exploratory Data Analysis, also known as EDA, helps data scientists understand the structure and behaviour of a dataset.
Claude can help generate:
- Summary statistics.
- Frequency distributions.
- Correlation analysis.
- Histograms.
- Box plots.
- Scatter plots.
- Category comparisons.
These outputs make it easier to understand patterns before starting advanced analysis.
Example: Creating a Data Cleaning Skill
Suppose you regularly analyse customer sales datasets.
You can create a skill with instructions such as:
# Customer Data Cleaning Skill

## Purpose
Clean and inspect customer sales datasets.

## Instructions
1. Load CSV and Excel files using Pandas.
2. Check rows, columns and data types.
3. Identify missing values and duplicates.
4. Check unusual values and inconsistent formats.
5. Generate descriptive statistics.
6. Create useful EDA charts.
7. Explain every major data-quality issue.
8. Never delete original data without permission.

## Final Output
- Dataset overview
- Data quality report
- Cleaning recommendations
- Python code
- EDA visualizations
- Cleaned dataset, when requested
This is an example of a custom skill, not an official Anthropic-provided data-cleaning skill.
Benefits for Data Scientists
A data cleaning skill can help you:
- Reduce repetitive data preparation work.
- Identify data-quality problems earlier.
- Follow a consistent cleaning process.
- Generate reusable Python code.
- Understand unfamiliar datasets faster.
- Prepare datasets for statistical and machine learning tasks.
Practical example: If you work with sales data every week, you can use the same skill to inspect monthly sales files and produce reports using a consistent process.
However, always review the cleaning decisions before using the resulting dataset for important business decisions.
3. Skill Two: Python Programming and Statistical Analysis

Python is one of the most widely used programming languages in data science. It provides powerful libraries for data processing, statistics, machine learning, and visualization.
However, writing Python code is not the only challenge. Data scientists also need to understand statistical concepts and select the correct analytical methods.
A Claude Python and Statistical Analysis Skill can help with both responsibilities.
Instead of asking Claude to write random code, you can give it a structured workflow for producing understandable, testable, and statistically appropriate solutions.
What Does This Skill Do?
This skill can guide Claude when working with Python programming, statistical calculations, hypothesis testing, and analytical problem-solving.
It can support tasks such as:
- Writing Python scripts.
- Explaining existing code.
- Debugging programming errors.
- Working with Pandas and NumPy.
- Performing descriptive statistics.
- Conducting hypothesis tests.
- Calculating confidence intervals.
- Interpreting statistical results.
- Preparing reproducible analysis notebooks.
Important Python Libraries for Data Scientists
1. Pandas
Pandas is used to work with structured datasets. It helps data scientists read files, filter records, combine tables, clean columns, and perform data analysis.
Claude can help write Pandas code for everyday tasks.
For example, you can ask it to calculate monthly revenue from a sales dataset or group customer records by location.
2. NumPy
NumPy is useful for numerical calculations and working with arrays.
Claude can help generate NumPy code for mathematical operations, numerical transformations, and scientific computing.
3. SciPy
SciPy provides tools for scientific and statistical computing.
It can support tasks involving probability distributions, statistical tests, optimization, and other mathematical operations.
4. Statsmodels
Statsmodels is useful for statistical modelling.
Data scientists can use it for regression analysis, hypothesis testing, time-series analysis, and statistical summaries.
5. Scikit-learn
Scikit-learn provides tools for machine learning, preprocessing, model selection, and evaluation.
Claude can help you understand its functions and develop suitable workflows.
How Claude Can Help With Statistical Analysis
Statistical analysis helps you make decisions based on evidence instead of assumptions.
Consider a company that wants to understand whether a new marketing campaign increased sales.
You have sales data from before and after the campaign. Simply comparing two average values may not be enough to establish whether the difference is meaningful.
Claude can help you understand which statistical method may be appropriate.
For example:
- Descriptive statistics help summarise the dataset.
- A t-test can compare means under suitable assumptions.
- A chi-square test can examine relationships between categorical variables.
- Correlation analysis can measure associations between numerical variables.
- Regression analysis can estimate relationships between variables.
Claude can also explain p-values, confidence intervals, statistical significance, and effect sizes in simple language.
Remember that statistical tests have assumptions. Claude should check those assumptions and explain when a method may not be appropriate.
Example: Creating a Python and Statistics Skill
# Python and Statistical Analysis Skill

## Purpose
Help with Python programming and statistical analysis.

## Instructions
1. Use Python for analytical tasks.
2. Prefer Pandas and NumPy for data processing.
3. Use SciPy and Statsmodels when appropriate.
4. Explain code in simple language.
5. Check statistical assumptions before selecting tests.
6. Explain p-values and confidence intervals.
7. Include comments in Python code.
8. Identify possible errors and limitations.
9. Never invent statistical results.

## Final Output
- Problem explanation
- Recommended statistical method
- Python code
- Results and interpretation
- Limitations and assumptions
Benefits for Data Scientists
This skill can help you:
- Write Python code more efficiently.
- Understand complex statistical concepts.
- Debug common programming errors.
- Reduce repetitive coding tasks.
- Learn new Python libraries.
- Improve the readability of analytical code.
- Make statistical workflows easier to reproduce.
Practical example: Imagine that you receive a customer satisfaction dataset and need to compare ratings across different customer groups. Claude can help you prepare the Python code, select an appropriate statistical test, and explain the findings.
You should still run the code, inspect the output, and verify that the selected statistical method matches your research question.
4. Skill Three: Machine Learning and Predictive Modelling

Machine learning is an important part of modern data science. Businesses use machine learning models to predict customer behaviour, detect fraud, forecast sales, recommend products, and identify business opportunities.
Building a reliable machine learning model requires more than writing a few lines of Python code.
A data scientist needs to understand the business problem, prepare the dataset, select suitable algorithms, train models, evaluate their performance, and check whether the results are reliable.
A Claude Machine Learning and Predictive Modelling Skill can provide a reusable workflow for these activities.
What Does This Skill Do?
This skill teaches Claude how to assist with machine learning projects in a structured way.
It can help with:
- Understanding machine learning problems.
- Selecting suitable algorithms.
- Preparing training and testing datasets.
- Performing feature engineering.
- Building baseline models.
- Training machine learning algorithms.
- Evaluating model performance.
- Comparing different models.
- Identifying overfitting and underfitting.
- Explaining model limitations.
Important Machine Learning Tasks
1. Selecting the Right Machine Learning Algorithm
Different problems require different machine learning algorithms.
For example, a company that wants to predict house prices may need a regression model. A company that wants to identify whether a customer will leave its platform may need a classification model.
Claude can help compare suitable algorithms based on the dataset and business objective.
Common algorithms include:
- Linear Regression.
- Logistic Regression.
- Decision Trees.
- Random Forest.
- Gradient Boosting.
- Support Vector Machines.
- K-Means Clustering.
- XGBoost.
The best algorithm depends on the problem, dataset size, feature types, evaluation requirements, and operational needs.
2. Feature Engineering
Feature engineering involves creating, transforming, or selecting useful variables for machine learning.
For example, an e-commerce company may have customer purchase dates and transaction records.
A data scientist could create additional features such as:
- Total customer purchases.
- Average order value.
- Days since the last purchase.
- Number of orders in the previous month.
- Customer lifetime value estimates.
Claude can suggest feature engineering approaches and generate Python code for implementation.
However, it is important to avoid using information that would not be available at the time of prediction.
3. Model Training
After preparing the dataset, the next step is model training.
Claude can help create a machine learning pipeline using Scikit-learn.
A typical workflow includes data preprocessing, train-test splitting, model selection, training, and evaluation.
4. Model Evaluation
A model that performs well during training may not perform well on new data.
This is why model evaluation is essential.
Claude can help calculate and explain metrics such as:
| Metric | Purpose |
|---|---|
| Accuracy | Measures overall correct predictions |
| Precision | Measures how many positive predictions were correct |
| Recall | Measures how many actual positive cases were identified |
| F1-score | Balances precision and recall |
| ROC-AUC | Measures ranking performance across classification thresholds |
| MAE | Measures average absolute prediction errors |
| RMSE | Gives greater weight to larger prediction errors |
| R² | Measures explained variation in regression |
The correct metric depends on the business problem.
For example, a fraud detection model may need high recall because missing fraudulent transactions can be expensive. A model that predicts product demand may be evaluated using MAE or RMSE.
Example: Creating a Machine Learning Skill
# Machine Learning Skill

## Purpose
Support end-to-end machine learning projects.

## Instructions
1. Understand the business problem.
2. Identify the target variable.
3. Inspect the dataset.
4. Check data leakage risks.
5. Recommend suitable algorithms.
6. Prepare training and testing datasets.
7. Build a baseline model.
8. Train and compare models.
9. Evaluate performance using relevant metrics.
10. Explain overfitting and underfitting.
11. Document model limitations.

## Final Output
- Problem definition
- Data preparation plan
- Algorithm selection
- Python implementation
- Model evaluation
- Recommendations
Real-World Example: Customer Churn Prediction
Imagine that a subscription-based company wants to identify customers who may cancel their subscriptions.
The company has historical information about customer age, subscription duration, monthly payments, service usage, and cancellation history.
Using this skill, Claude can help you:
- Understand the customer churn problem.
- Identify the target column.
- Inspect and clean customer records.
- Prepare suitable features.
- Create training and testing datasets.
- Build a classification model.
- Compare model performance.
- Explain which factors may be associated with customer churn.
The data scientist can then use the findings to help the business develop customer retention strategies.
Benefits for Data Scientists
A machine learning skill can help you:
- Build structured machine learning workflows.
- Experiment with different algorithms.
- Generate Python implementation code.
- Understand model evaluation metrics.
- Identify possible data leakage.
- Improve model documentation.
- Reduce repetitive experimentation work.
However, Claude cannot guarantee that a generated model will be accurate or suitable for production. Model performance must be tested on appropriate data, and important decisions should be reviewed by qualified professionals.
5. Skill Four: Data Visualization, Dashboard Creation, and Reporting

Data analysis is not complete when you calculate numbers. You also need to explain what those numbers mean.
A data scientist may discover an important pattern in customer behaviour, sales performance, or marketing results. However, if business managers cannot understand the findings, the analysis may not lead to useful decisions.
This is why data visualization and reporting are essential skills.
A Claude Data Visualization and Reporting Skill can help convert analytical results into understandable charts, dashboards, and business reports.
What Does This Skill Do?
This skill guides Claude to select suitable visualizations, generate plotting code, explain analytical findings, and prepare reports for different audiences.
It can help you:
- Create charts using Python.
- Build data visualization reports.
- Generate dashboard layouts.
- Compare business performance.
- Present trends and patterns.
- Explain analytical findings.
- Prepare executive summaries.
- Create reports using Excel or PowerPoint.
Important Data Visualization Tools
1. Matplotlib
Matplotlib is a popular Python library for creating charts and graphs.
Claude can help you create line charts, bar charts, histograms, scatter plots, and other visualizations.
2. Seaborn
Seaborn is built on Matplotlib and makes statistical visualization easier.
It is useful for correlation heatmaps, distribution plots, and comparisons between different variables.
3. Plotly
Plotly supports interactive visualizations.
You can use it to build charts where users can hover over data points, explore values, and interact with visual elements.
4. Power BI
Power BI is a business intelligence platform used to create interactive dashboards and reports.
Claude can assist with understanding data models, writing DAX formulas, preparing measures, and planning dashboard structures.
5. Tableau
Tableau is another widely used data visualization platform.
Claude can help plan dashboards, suggest suitable charts, and explain how to communicate analytical findings.
How Claude Can Improve Data Visualization
1. Choosing the Right Chart
Not every chart is suitable for every type of data.
For example:
- Use a line chart to show changes over time.
- Use a bar chart to compare categories.
- Use a histogram to understand data distribution.
- Use a scatter plot to explore relationships.
- Use a box plot to compare distributions and identify possible outliers.
- Use a heatmap to display patterns in a matrix.
Claude can suggest the most suitable chart based on your analytical objective.
2. Creating Business Dashboards
A business dashboard brings important information into one place.
For example, an e-commerce dashboard may include:
- Total revenue.
- Total orders.
- Average order value.
- Customer acquisition.
- Product performance.
- Monthly sales growth.
- Customer retention.
Claude can help organise these metrics and generate supporting Python code or dashboard specifications.
3. Explaining Data Insights
A chart is useful, but understanding its meaning is even more important.
Suppose your sales dashboard shows that revenue increased by 20% during a particular month.
Claude can help you explain the change, compare it with previous periods, and identify possible factors that need further investigation.
It should not claim that a marketing campaign caused the increase unless the available evidence supports that conclusion.
4. Creating Reports for Different Audiences
Technical reports and business reports have different requirements.
A technical report may include statistical methods, model performance, assumptions, and detailed charts.
A business report may focus on key findings, business impact, risks, and recommended actions.
Claude can help present the same analysis in a format that is easier for each audience to understand.
Example: Creating a Data Visualization Skill
# Data Visualization and Reporting Skill

## Purpose
Create clear and accurate data visualizations
and analytical reports.

## Instructions
1. Understand the purpose of the analysis.
2. Identify the important metrics.
3. Select suitable chart types.
4. Use Matplotlib, Seaborn or Plotly.
5. Add meaningful titles and labels.
6. Avoid misleading scales and comparisons.
7. Explain important patterns.
8. Separate facts from assumptions.
9. Prepare a simple executive summary.

## Final Output
- Key performance indicators
- Recommended charts
- Python visualization code
- Data insights
- Business interpretation
- Final report
Benefits for Data Scientists
This skill can help you:
- Present complex data in simple language.
- Create charts more efficiently.
- Build structured analytical reports.
- Improve communication with stakeholders.
- Highlight important business trends.
- Prepare professional presentations.
- Make data-driven decisions easier to understand.
Practical example: If you analyse the monthly sales performance of a retail company, Claude can help you create revenue charts, product comparisons, customer analysis, and an executive summary that managers can understand without reading the entire Python notebook.
6. How to Create Your Own Claude Skills for Data Science
You do not need to be an expert developer to create a basic Claude Skill. You can start with a simple Markdown file and gradually add Python scripts, reference documents, and reusable templates.
Anthropic’s skill creation documentation explains that every skill needs a SKILL.md file containing the required name and description metadata. Additional files and scripts are optional. Claude Help Center+1
Here is a practical step-by-step process.
Step 1: Identify a Repetitive Data Science Task
First, identify a task that you perform regularly.
For example:
- Cleaning customer datasets.
- Preparing monthly sales reports.
- Running statistical tests.
- Training classification models.
- Creating data visualization dashboards.
Choose one specific task instead of creating a skill that tries to handle everything.
Step 2: Create a Skill Folder
Create a folder with a descriptive name.
For example:
data-cleaning-skill/
│
├── SKILL.md
│
├── scripts/
│   └── clean_data.py
│
└── resources/
    └── data_quality_guide.md
The SKILL.md file contains the main instructions. The scripts folder can contain reusable Python programs, while the resources folder can contain additional reference materials.
Step 3: Write the Skill Instructions
Your skill should explain what Claude needs to do, when it should use the skill, and what the final output should look like.
For example:
---
name: data-cleaning
description: Clean, inspect, and prepare CSV and Excel
datasets for data science and machine learning tasks.
---

# Data Cleaning Workflow

## Objectives
Prepare reliable datasets for analysis.

## Process
1. Inspect the uploaded dataset.
2. Check missing values.
3. Identify duplicate records.
4. Validate data types.
5. Detect unusual observations.
6. Recommend cleaning methods.
7. Generate Python code.
8. Explain all changes.

## Rules
- Never overwrite original files.
- Do not remove important records without approval.
- Explain assumptions.
- Validate the final dataset.

## Output
Provide a data quality report and
a cleaned dataset when requested.
Step 4: Add Python Scripts and Reference Files
Once your basic skill works, you can add scripts to perform repeatable operations.
For example, you can create a Python script that checks missing values, detects duplicate rows, and generates a dataset summary.
You can also add reference documents explaining your organisation’s data standards, preferred naming conventions, or approved analytical methods.
This makes the skill more useful for specialised projects.
Step 5: Test Your Skill With Real Datasets
Testing is essential.
Try your skill with different datasets, including files with missing values, duplicates, inconsistent formats, and unusual observations.
Check whether Claude follows your instructions and produces the expected results.
If it makes mistakes, improve the instructions and test again.
Step 6: Upload and Enable the Skill
For Claude.ai, individual users can generally access the Skills area through Customize → Skills after enabling the required code execution and file creation capabilities.
You can upload your custom skill and enable it for relevant tasks. Exact availability and organisation settings depend on your Claude plan and workspace configuration. Claude Help Center+1
You can also use Agent Skills in supported Claude Code and API workflows.
Official documentation: How to create custom Skills in Claude.
7. Can Data Scientists Combine All Four Claude Skills?
Yes. Combining the four skills can create a more complete data science workflow.
Instead of treating data cleaning, statistical analysis, machine learning, and reporting as completely separate activities, you can use them together.
For example, imagine that an e-commerce company wants to understand customer purchasing behaviour and predict future customer churn.
You can organise the work into four stages.
Stage 1: Data Cleaning and EDA
Start by uploading customer transaction data. Claude can use the data cleaning skill to inspect the dataset, identify missing values, check duplicates, and explore customer behaviour.
Stage 2: Python and Statistical Analysis
Next, use the statistical analysis skill to calculate customer averages, examine purchasing patterns, compare customer groups, and test relevant hypotheses.
Stage 3: Machine Learning
After preparing the data, use the machine learning skill to build a customer churn prediction model. Compare suitable algorithms and evaluate their performance.
Stage 4: Visualization and Reporting
Finally, use the visualization skill to prepare charts, customer segments, model performance summaries, and business recommendations.
The complete workflow looks like this:
Complete AI-powered data science workflow
1. Data Cleaning and EDAInspect, clean and understand datasets
2. Python and Statistical AnalysisAnalyse variables and test hypotheses
3. Machine LearningTrain, test and evaluate predictive models
4. Visualization and ReportingCommunicate findings and recommendations
Business Insights and DecisionsSupport informed, evidence-based decisions
The biggest advantage is consistency. You can reuse your instructions across projects rather than explaining your preferred workflow from the beginning every time.
Anthropic also explains that multiple skills can work together when their capabilities are relevant to a task. Claude Platform Docs+1
8. Important Limitations of Claude Skills for Data Scientists
Claude Skills can improve productivity, but they are not a replacement for professional data science knowledge.
You should understand their limitations before using them in real-world projects.
1. AI-Generated Code Can Contain Errors
Claude may generate Python code that looks correct but produces incorrect results. Always execute and test the code before using it.
2. Data Privacy Is Important
Customer databases, financial information, and business records may contain sensitive information. Follow your organisation’s data protection policies before uploading files to an AI platform.
3. Statistical Results Need Verification
Claude can recommend statistical tests, but you must check whether the assumptions, sample size, and research design are appropriate.
4. Machine Learning Models Need Proper Evaluation
A model can produce impressive training results while performing poorly on unseen data. Always check for overfitting, data leakage, bias, and model stability.
5. Visualizations Can Be Misleading
A chart with an incorrect scale or missing context can create the wrong impression. Review chart labels, data sources, units, and comparisons.
6. Skills Do Not Automatically Guarantee Accuracy
A well-written skill can improve consistency, but its results still depend on the quality of the instructions, available data, execution environment, and validation process.
The best approach is to use Claude as an assistant while keeping human judgment and verification at the centre of your data science workflow.
9. Final Thoughts: Which Claude Skills Should You Learn First in 2026?
Claude Skills are becoming a useful way to make AI-assisted work more structured and repeatable.
For data scientists, the four most valuable custom skill areas to start with are data cleaning and EDA, Python and statistical analysis, machine learning and predictive modelling, and data visualization and reporting.
Each skill solves a different problem, but together they can support almost every major stage of a data science project.
If you are a beginner, start with data cleaning and Python programming. These skills will help you understand datasets and develop stronger analytical foundations.
If you already have data science experience, focus on machine learning workflows, model evaluation, and automated reporting.
Remember that the goal is not to let AI make every decision. The goal is to spend less time repeating routine instructions and more time understanding data, solving problems, and creating meaningful insights.
In 2026, data scientists who combine strong technical knowledge with practical AI workflows will be better prepared to work efficiently in an increasingly AI-driven industry.
10. Frequently Asked Questions (FAQs)
1. What are Claude Skills in data science?
Claude Skills are reusable packages of instructions, scripts, and resources that help Claude perform specific data science tasks. They can support data cleaning, Python programming, statistical analysis, machine learning, and reporting.
2. Which Claude Skills are most useful for data scientists in 2026?
The four recommended skill areas are:
- Data Cleaning and Exploratory Data Analysis.
- Python Programming and Statistical Analysis.
- Machine Learning and Predictive Modelling.
- Data Visualization and Reporting.
3. Can Claude Skills help with Python programming?
Yes. Custom Claude Skills can guide Python code generation, debugging, data processing, statistical calculations, and documentation using libraries such as Pandas, NumPy, SciPy, and Scikit-learn.
4. Can Claude analyse Excel and CSV files?
Yes. With the required file and code execution capabilities, Claude can help inspect Excel and CSV files, calculate statistics, identify missing values, explore trends, and generate analytical reports.
5. Can Claude Skills build machine learning models?
Claude Skills can guide machine learning workflows, including data preprocessing, feature engineering, algorithm selection, model training, and performance evaluation. Generated models should always be tested and validated.
6. Are Claude Skills free to use?
Claude Skills are available across supported Free, Pro, Max, Team, and Enterprise plans, subject to feature requirements and workspace settings. Code execution must be enabled for the relevant experience.
7. Do I need Python knowledge to use Claude Skills?
No, you do not need advanced Python knowledge to get started. However, understanding basic Python, statistics, and data science concepts will help you evaluate the generated code and results.
8. Can beginners use Claude Skills for learning data science?
Yes. Beginners can use custom skills to understand datasets, learn Python libraries, explore statistical concepts, and practise machine learning workflows. They should treat Claude as a learning assistant rather than blindly accepting its answers.
9. Can multiple Claude Skills work together?
Yes. Multiple relevant skills can work together. For example, a data-cleaning skill can prepare a dataset, a machine learning skill can build a predictive model, and a visualization skill can present the results.
10. How do I create a custom Claude Skill for data analysis?
Create a folder containing a SKILL.md file with a name, description, and clear instructions. You can also add Python scripts and reference documents. Test the skill with real datasets before using it regularly.
11. Can Claude Skills replace data scientists?
No. Claude Skills can automate repetitive activities and support technical workflows, but data scientists are still needed to understand business problems, validate results, select appropriate methods, and make informed decisions.
12. What is the biggest benefit of Claude Skills for data scientists?
The biggest benefit is reusable expertise. Data scientists can create structured workflows once and reuse them across different projects, reducing repetitive instructions and improving consistency.